Poverty vs. Federal Poverty Level
Poverty means lacking sufficient money for your basic needs, but what does that really look like and how do we measure it in the United States? There are two ways the government defines poverty: poverty thresholds and poverty guidelines. While thresholds are used for statistical purposes like collecting data on poverty rates for the census, the guidelines are used administratively to determine eligibility for federal programs. When we think of “poverty,” we are most likely thinking about poverty thresholds. And when we talk about the “federal poverty level (FPL),” we are referring to poverty guidelines.
What do these two types of measurement mean in practice? Let’s start by comparing them.
The Difference Between Federal Poverty Thresholds and Federal Poverty Guidelines
There are two federal poverty measures:
Poverty thresholds
- annually updated by the Census Bureau
- new thresholds issued in September for the previous calendar year
- used for statistical purposes, including official poverty population statistics
- no geographic variation
- vary by family size, number of children under 18, and one- and two-person households with people over 65
Poverty guidelines (also called Federal Poverty Level)
- annually issued by the Department of Health and Human Services
- new guidelines issued in January for same calendar year
- used for administrative purposes, including determining financial eligibility for certain federal programs
- guidelines for the contiguous United States, and separate ones for Alaska and Hawaii
- vary by family size
Comparing 2017 Poverty Thresholds and Poverty Guidelines
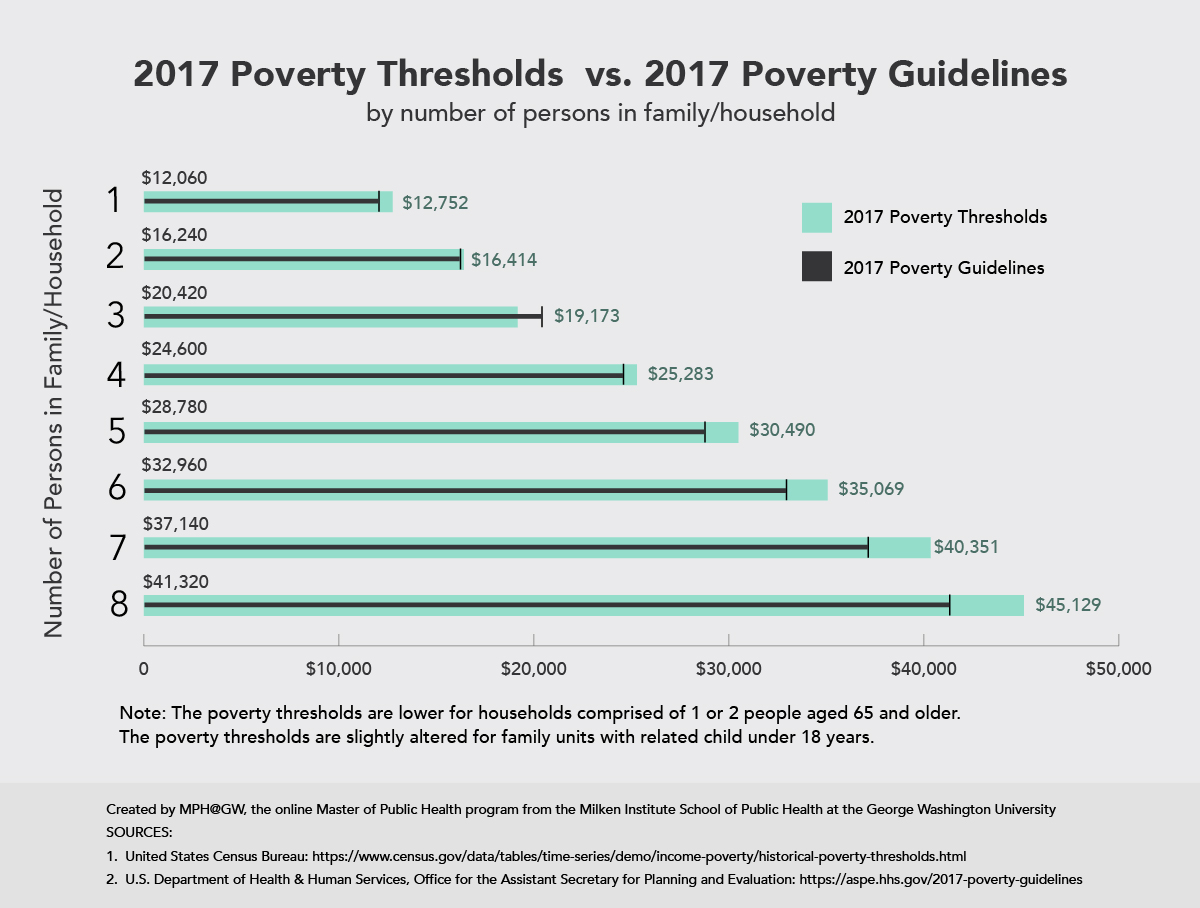
Go to a tabular version of 2017 Poverty Thresholds and Poverty Guidelines.
Understanding the Poverty Threshold
Poverty thresholds are used for statistical purposes by the Census Bureau to determine the number of households, and the composition of those households, in poverty the previous year. These thresholds look at the number of people in the family unit, how many are under 18 years old, and if the householder is over 65. According to the Census Bureau, every individual in a household is considered in poverty if total income is less than the poverty threshold for that family unit. However. the poverty guidelines, not the poverty threshold, determine eligibility for certain federal programs.
2018 FPL Income Numbers
In the United States, the poverty guidelines are listed as 100 percent of the federal poverty level. The 100 percent FPL income numbers for 2018 are as follows:
$12,140 for individuals
$16,460 for a family of 2
$20,780 for a family of 3
$25,100 for a family of 4
$29,420 for a family of 5
$33,740 for a family of 6
$38,060 for a family of 7
$42,380 for a family of 8
Note: FPL income numbers are higher for both Alaska and Hawaii
Calculating Percentage of FPL
Often you may hear about certain programs where eligibility is limited to a percentage of FPL. To determine that number, multiply the percentage by the income numbers. For example: 100 percent of FPL for a one-person household is $12,140. 138 percent of FPL for a one-person household would be $12,140 x 1.38, which equals $16,753. For another example, let’s take a family of four living at 400 percent of FPL. If 100 percent of FPL for them is $25,100, then 400 percent would be four times that, or $100,400. Conversely, if you know your income and want to calculate the percentage of your income in relation to the federal poverty level:
- take your income
- divide by the poverty guideline income level for your household size
- multiply that number by 100
- add a percentage sign
For example, if your income is $35,000 and you are in a three-person household, divide $35,000 by $20,780 (100 percent of FPL for a family of three in 2018), which equals about 1.68. Multiply by 100 to get the percentage. Your income level is 168 percent of the federal poverty guidelines, or 168 percent FPL.
Distribution of Total Population by Federal Poverty Level
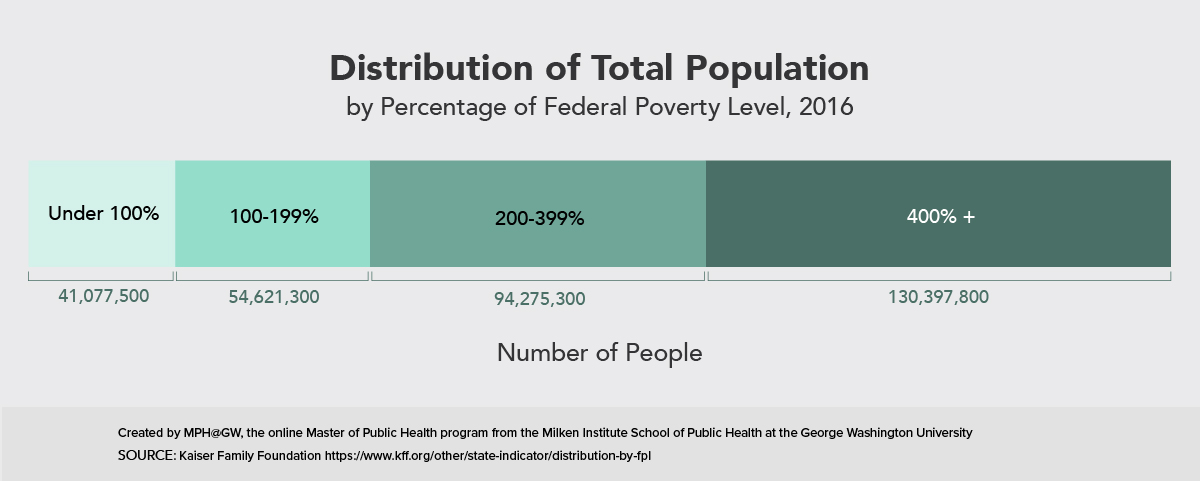
Go to a tabular version of Distribution of Total Population by Federal Poverty Level.
Why the FPL Matters to Public Health
Federal poverty levels are used to determine eligibility for certain federal programs, including Medicaid and Children’s Health Insurance Program (CHIP).
According to Healthcare.gov, if your income falls:
below 138 percent FPL and you’re a resident of a state that has expanded Medicaid coverage, your income could qualify you for Medicaid;
below 100 percent FPL and you’re a resident of a state that has NOT expanded Medicaid coverage, your income alone won’t qualify for Medicaid or savings on a Marketplace health insurance plan.
While federal poverty levels determine eligibility for certain types of health coverage, thereby determining an individual’s ability to seek health treatment, poverty itself is a social determinant of health that can increase people’s vulnerability to poorer health.
“Social determinants of health are conditions in the environments in which people are born, live, learn, work, play, worship, and age that affect a wide range of health, functioning, and quality-of-life outcomes and risks.”
Lower-income Americans experience higher rates of disease , such as heart disease, bronchitis, diabetes, liver disease, and arthritis, than Americans with higher incomes. Poverty may increase the likelihood of the onset of mental illness, intensify the experience, or prevent people from accessing proper treatment. And people of lower socioeconomic status are also more likely to be obese, which is a condition associated with numerous additional risk factors and diseases.
Poverty and Aging
While poverty can increase anyone’s vulnerability to disease and access to treatment, one population is particularly at risk: people over 65. According to AARP, approximately 6.4 million older Americans lived at or below FPL in 2016. Aging Americans already face health challenges associated with their age. Compounded with poverty, these challenges are even harder to address. For more information about the growing cost of aging in the U.S, check out our three-part series.
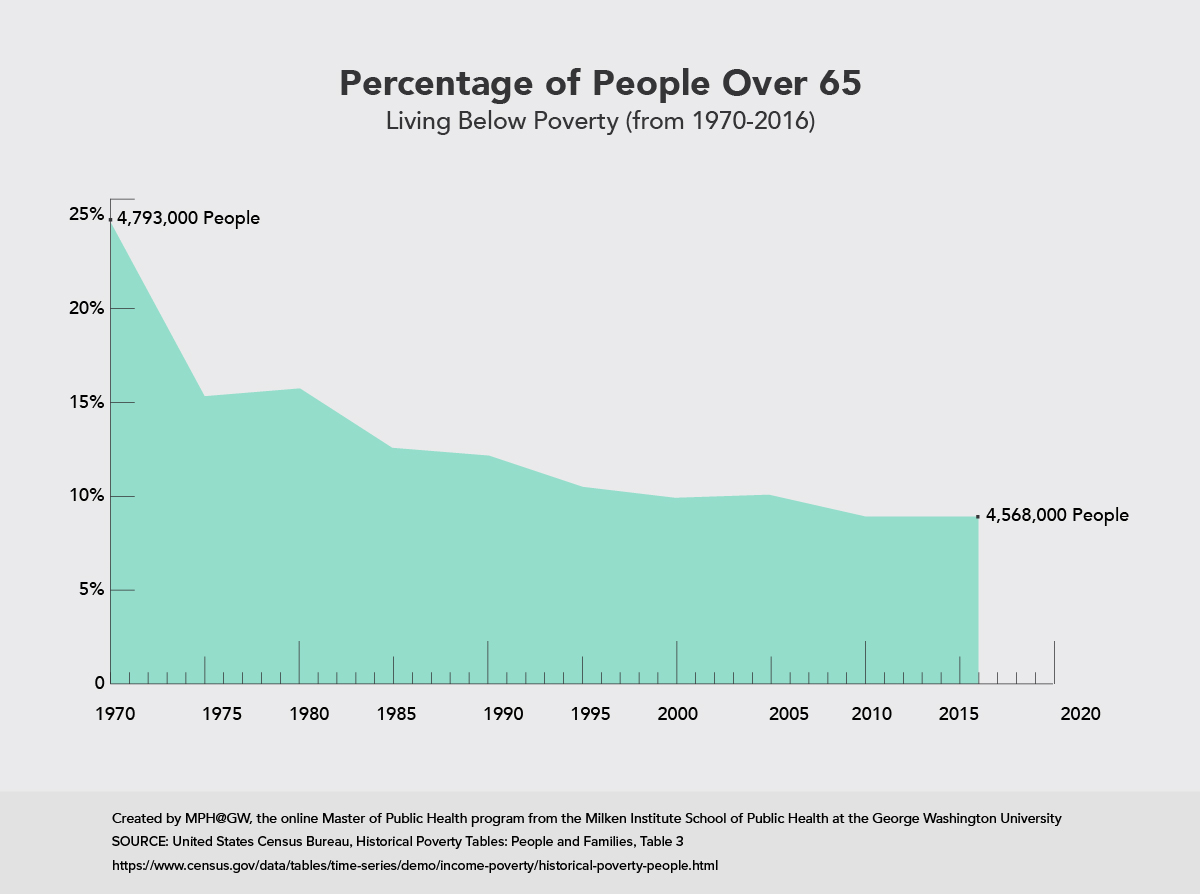
Go to a tabular version of Percentage of People Over 65 Living Below Poverty.
Citation for this content: MPH@GW, the online Master of Public Health program from the Milken Institute School of Public Health at the George Washington University